2 Procedure of designing monitoring system for REDD+ project
(1) Introduction
When implementing REDD+ at the project level, reflecting the outcome of the REDD+ activity at the project level on the REDD+ activity at the national level is necessary to effectively and efficiently carry out various REDD+ activities in a certain country while keeping consistency of various REDD+ activities.
Myanmar rich in forest resources is high in the deforestation. Myanmar took part in UN-REDD in 2011, therefore, the system for implementing REDD+ has not fully developed yet. In this study, we clarify what is needed for monitoring forest carbon stocks both at the project level and at the national level with the counterpart and stakeholders through designing the forest carbon monitoring system, assuming the REDD+ project will be implemented in the host country.
In 2016, we showed the prototype of the procedure for designing forest carbon monitoring at the project level in the target area, implemented research, and collected necessary information for estimating forest carbon stocks (such as emission factors and drivers of deforestation).
(2) Consideration on procedure for designing forest carbon monitoring
In this sub-theme, we consider the procedure necessary for monitoring design, intending that forest carbon monitoring for REDD+ activity at the project level is implemented in Myanmar. The government of Myanmar released "Myanmar REDD+ Readiness Roadmap" in 2013. In response to this, two action plans; "Forest (Emissions) Reference Level action plan for Myanmar" and "Development of a National Forest Monitoring System for Myanmar", was released by 2015 (http: // www. myanmar-redd.org/index.php).
The Forest Department (FD) of Myanmar tries various methods in a joint project related to REDD+ in the forest in Myanmar and evaluates their effectiveness and collects data on forest carbon stocks by region and incorporates them into the action plan. Responding to this, the report outlined the projects related to REDD+ activities that have been implemented or planned in Myanmar, "Existing and Planned Activities Completing REDD + in Myanmar" (http: // www.myanmar-redd.co.jp). org / pdf / reports / eng 1477803092.pdf) was publised. In the report, 38 projects including the projects for capacity building and for five components of REDD+ are explained. As explained in the report, since the system for developing monitoring and reference level at the national level and necessary data are not sufficient in Myanmar, the information for considering the consistency with the project level is insufficient accordingly.
Meanwhile, systems for developing monitoring and reference level at national revel have not been developed in most cases, therefore, when implementing at the project level, we need to design while collecting information.
In 2016, we set five stages (Fig. 7) for the procedure of designing forest carbon monitoring system: (1) plan (advance preparation), (2) understanding of deforestation and forest degradation, (3) selection of project target site, (4) selection of forest carbon monitoring methodology, and (5) implementation and report of the project and considered the information and actions required at each stage. We will report necessary information and requirements to be confirmed at each stage with items considered in Myanmar.
①Plan (advance preparation)
It is necessary to understand the efforts related to REDD+ in the target country intended to implement the project. When considering how to avoid double accounting and how to allocate reference level, it is important to take the consistency with the project at the national level into consideration.
We have outlined the situation of preparing REDD+ in Myanmar so far. In 2017, the action plan will be released as a new progress. In addition, the National Forest Inventory (NFI) has been carried out with the support from Finland at eight provinces in Myanmar as model areas since 2016, and its measurement design (a quadrat of 50 m x 50 m) was made public. In the NFI, survey of not only tree species but also fauna is included to take biodiversity into consideration. It will take time before the NFI results are published. However, with the establishment of the measuring method such as allocation of plots and design of plots, the NFI can be used as a benchmark in considering survey method for emission factor.
②Understanding of drivers of deforestation and forest degradation
In the REDD plus activities, it is necessary to fully understand the drivers of deforestation and forest degradation and to consider how to address them. Efforts to identify the drivers of deforestation and forest degradation are also indispensable in the host countries including Myanmar. Main drivers of deforestation in Myanmar (direct cause) are conversion of land use to agriculture, development of mining, and construction of hydropower dams and infrastructure. In Myanmar, the power shortage is serious in urban areas. To address this, hydroelectric dams are constructed, which is one of the drivers. Due to the construction of dams, many local communities moved to other places. Due to this relocation, deforestation and forest degradation has occurred and eventually deforestation and forest degradation in larger area than that of buried in the dam construction is occurred.
Development of mine is also a major driver of deforestation. In April 2015, the Ministry of Mines, which supervised the mining development, and the Ministry of Environmental Protection and Forestry, which managed forests, was integrated and reorganized as the Ministry of Natural Resources and Environmental Conservation (MONREC). We need to monitor how future measures in forest development actions will change through the integration of these conflicting ministries.
③Selection of project target areas
In choosing a project site, it is important to be able to obtain credits through the project activities. Understanding and cooperation of the local community and obtaining information on safeguards by advance survey are also necessary.
In this study, we selected Paung Luang Reserved Forest (RF) in southern Shan province as a provisional project site. We have selected a candidate site by 2015 and clarified the boundary of the project area in 2016. In order to decide the boundary, it is necessary to establish standard, taking account of the following points:
- do not include multi-vegetation types (the target area can be classified only by semi-evergreen forest)
- drivers of deforestation and forest degradation are almost same (not complicatedly mixed), and
- do not include a special location such as peat wetland.
After establishing the boundary, interviews with foresters in the host country and local community to understand the condition of the forest in the target area was conducted and found several problems. One of them is access restriction due to ethnic conflict. In some cases, restriction is further expanded and in worst scenario, the project itself may be canceled. Companies are also restricted from entering to develop mines. In some cases, even access to the surrounding area is not permitted, therefore, the boundary is reorganized to exclude these areas.
④Selection of methodology
In estimating forest carbon stocks, it is necessary to apply a highly transparent and verifiable methodology. If there are hypothetical conditions used to select the measurement method, it is necessary to show validity. For example, when calculating the amount of carbon stocks per unit area based on the tree censu data obtained by the ground inventory survey, the calculation result will differ depending on what type of allometric formula (or expansion factor) is used. Whether or not the allometric formula developed in the forest of the target country is the information that should be confirmed in ① Plan (advanced preparation), but after deciding the project site, more specific consideration is needed. In Myanmar, an allometric formula for several species of bamboo and other trees around Bago has been developed, but the formula does not include the underground parts. At the expert meeting on MRV held in Nepido in June 2016, the allometric formula in Myanmar is developed mainly for afforestation species such as teak and Xylia xylocarpa. In order to estimate highly accurate biomass, a new formula for each species1 needs to be developed and a new formula will be developed. In this study, we used a general formula (Chave et al. 2014)applicable in the wide tropical forest area as an allometric formula. Since the calculation result differs depending on the allometric formula, it is necessary to discuss with the local stakeholders whether the formula to be used is appropriate and examine the difference with the formula used by NFI.
After proceeding to this stage, we will examine the design of the monitoring system.
1 Please refer: http://www.myanmar-redd.org/pdf/meeting_minutes/eng_1481517462.pdf
⑤Implementation and report of the project
Measures are taken based on the plan of the project, but monitoring the displacement is also important. In addition, sustainable forest carbon monitoring can be done by monitoring at low cost without reducing measurement accuracy. For that, understanding and participation of local communities is essential.
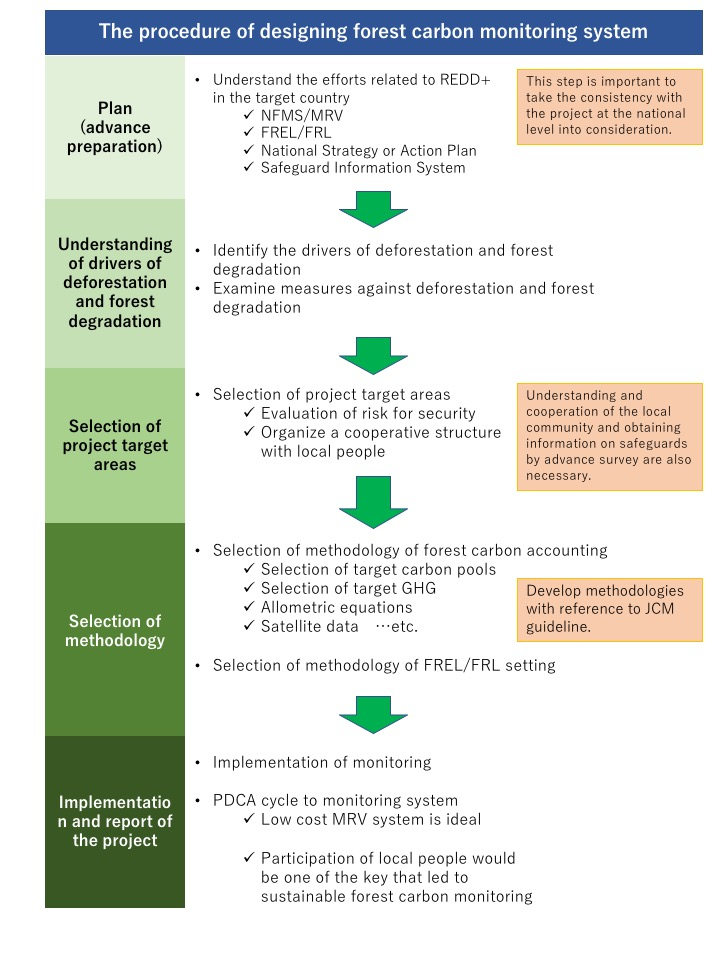
Fig. 7 An example of designing procedure of forest carbon monitoring system at the project level
(3) Ground-based survey for forest carbon monitoring
①Result of ground-based inventory
We conducted a ground-based inventory of forest carbon stocks through the ground inventory with the aim of showing the procedure for designing monitoring system of REDD+ project based on the case study. The target area was Paung Luang Reserved Forest (RF) in Shan State in Myanmar, the same area conducted last year (in the red frame of Fig. 8).
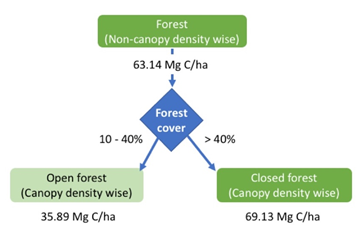
Fig. 8 Location of ground-based inventory in a virtual project area
The red frame indicates the boundary of the virtual project area, the purple frame indicates the survey area in FY2015, and the yellow frame indicates the survey area in FY2017.
Paung Luang Reserved Forest is semi-evergreen forest located in the mountains of Shan Stage with the area of 160,000 ha. Myanmar Timber Enterprise (MTE) is logging trees in a part of this area. Furthermore, people in local communities illegally enter many areas of RF and carry out slash-and-burning farming, and some parts of RF are legally used as a substitute for submerged land to build a reservoir.
We divided the virtual project area of about 154,000 ha set based on the preliminary survey in FY2015 into 200 m grid, selected the grid frame whose frame is dominated by forest, and determined the condition of the forest in each lattice frame to the following three types:
- Forest that many large canopies (diameter about 20 m) are distributed and have less influence of disturbance
- Forest that large crown canopies (diameter about 20 m)are sparsely distributed and has a heterogeneous structure due to selective cutting
- Secondary forest and forest plantation (small crown diameter, homogeneous structure)
In February 2017, we established a quadrat of 40 m x 40 m (24 quadrats in total) and conducted surveys in cooperation with forestry university graduates. In 2015, we conducted a survey in the area along the main road in Paung Luang RF (29 points in total) (in the purple frame in Fig. 8). In 2016, we set the north of the RF (in the yellow frame in Fig. 8) as the target area.
In Myanmar, forests are defined as forests with a crown coverage of 10% or more and minimum crown cover of 40% and are divided into closed forests and open forests. In this survey, as surveyed in 2015, we subdivided each plot into 10 m grids and confirmed the condition of the crown covering at 25 grid points and then calculated the crown coverage rate for each plot. In closed forest, based on the difference of the crown coverage of the bamboo, we further subdivided the closed forest into two types of tree dominant type (less than 50% coverage of bamboo) and bamboo dominant type (bamboo coverage 50% or more).
We obtained biomass of bamboos and the trees including underground parts from the survey data and examined the relationship with the crown covering ratio of each quadrat. As a result, we found that when the crown coverage rage is high, the biomass is also high.

Fig. 9 Relationship between canopy coverage and biomass
The biomass of the closed forest shows a relatively large value compared to that of the open forest, but in the closed forest where bamboo dominates, the difference in the biomass to the crown coverage rate tended to be small. In this survey, we found forest stands that showed extremely high biomass in the closed forest dominated by bamboo. In these forest stands, the bamboo consisting of the stocks of clums with breast height exceeding 30 cm in diameter was growing. Bamboo have a large biomass in some parts, but generally, the biomass of closed forest dominated by bamboo is considered to be smaller than that of closed forest where dominated by trees. Meanwhile, biomass of bamboo can not be ignored regardless of the ratio with trees. Many bamboos grown in the tropical including Myanmar are crowded with clums and measurement of the breast height necessary for the estimation of the biomass requires hard work sometimes. Saving labor for ground-based inventory may lead to cost reduction, but accuracy of estimation may be lowered. In the next section, we consider efficient measurement method for the inventory of bamboo that needs labor.
②Efficient measurement method for bamboo
As explained in (2) Consideration on the procedure of forest carbon monitoring design, as forests covering in Myanmar include not only trees but also bamboos, bamboos are an important carbon sink to understand the amount of carbon stocks. Among the 53 plots that carried out the ground survey by February 2017, bamboo was surveyed in 37 plots. Table 2 shows an outline of the bamboo measured so far. In these surveyed areas, an average of 576 bamboos per plot was examined, and in some plots, up to 2,612 bamboos are measured. In the allometric formula of bamboo in Myanmar and neighboring countries, the amount of biomass is calculated by multiplying the diameter and the cross section by a coefficient(Chan et al., 2016; Singh & Singh, 1999; Kiyono et al., 2007). However, because bamboo grows densely, the time needed for the survey including measurements of other tree species is increased due to the measurement of diameter of all bamboo.
Meanwhile, since secondary thickening growth does not occur in bamboo, bamboo is considered to have a relatively homogeneous size structure by the community unit. Therefore, the total amount of biomass can be estimated by measuring several diameters by species instead of measuring all bamboos growing in the plot, that is, estimate the average biomass of each bamboo from the average size by species (hereinafter referred to as average size) and then multiply the total number of bamboos in the plot. This will save labor for the survey. We confirmed the relationship between the number of measured bamboos and the variation in average size using a bootstrap method and examined the required number of bamboos to save labor (how many bamboos are needed to obtain the average size). Using the bamboo survey data examined in 37 plots, we changed the resampling rate to 100 to 1% for each plot and tree type (/in Wa Net, resampling rate among 123 bamboos, resampling rate 10%: 12 bamboos) and performed random and non-overlapping resampling (10,000 times each). With this, we calculated the average value and standard deviation of the average size of 10,000 times for each resampling rate and examined the required number of measurements using the coefficient of variation (CV) of average size as an index. The allometric formula is Kiyono et al(2007)and the size variable is the cross sectional area.
Table 2 General descriptions of bamboo measured in Paung Laung Reserve Forest, Myanmar
| Country of origin | Nomen | the number of plots | the number of bamboos | DBH | ||
| Average value | Standard deviation | Maximum value | ||||
| Kyat Thaung | Bambusa polymorpha | 9 | 3,685 | 6.8 | 2.4 | 13.0 |
| Tin Wa | Cephalostachyum pergricile | 11 | 5,240 | 5.4 | 3.3 | 28.0 |
| Wa Bo | Dendrocalamus brandisii | 26 | 3,595 | 8.2 | 4.4 | 42.0 |
| Wa Net | Bambusa vulgaris | 1 | 123 | 3.5 | 0.5 | 4.6 |
| Wa Nwe | Dinochloa macllelandii | 3 | 330 | 3.1 | 1.2 | 9.3 |
| Wa Gauk | Oxytenanthera albociliata | 23 | 10,281 | 2.8 | 1.1 | 14.2 |
| Htee Yoe War | Thyrosostachys siamensis | 1 | 10 | 11.6 | 1.8 | 16.1 |
| Thana Wa | Thyrsostachys oliveri | 3 | 940 | 19.6 | 7.3 | 34.0 |
Fig. 10 shows the relationship between the sample rate and the CV of average cross section. Generally, when the CV is 10% or less, it is considered that variation is small. Therefore, we extracted the maximum resampling rate at which the CV is 10% or less. In order to reflect this on the future survey, we generalized the relationship between the number of measurements and the resampling rate at which CV is 10% or less (Fig. 11) and obtained a regression equation. By multiplying the sample ratio obtained from this equation by the number of bamboos (the stem density of bamboo in the plot), the required number of resampling can be obtained. With this, if the stem density of the bamboo is determined, the number of resampling that CV can be 10% or less can be obtained (Fig.12). When determining the number of bamboos to be measured based on this in the ground-based survey, the stem density of bamboo by species is needed to determine the required number of measurements. Therefore, as shown in the red line in Fig. 12 in Table 3, the time required for the survey will be shortened by deciding the stem density and the target values of necessary number of measurements in advance, for example,
- measure all diameters until the number of bamboos become 50,
- from 50 to 500: count only the number of bamboos,
- from 501 to 520: add 20 for measuring diameter, and
- from 521 to 1,000: count only the number of bamboos (Method ①).

Fig. 10 Relationship between sampling ratio and the coefficient of variation (CV) for average bamboo biomass

Fig. 11 Relationship between the observed number of bamboo culms in a
plot for each species and minimum sampling ratio when the coefficient
of variation is less than 10%
(Power regression equation Y = 186.11 * X - 0.469)

Fig. 12 Relationship between bamboo density and required sampling number
(RN= 1.8611 * N 0.531)
Table 3 Summary of simplified required sampling numbers for bamboo survey procedure
| Stem density (N) | Required number of measurements |
| < 50 | N |
| 50 - 100 | 50 |
| 500 - 1,000 | 70 |
| 1,000 - 1,500 | 90 |
| 1,500 - 2,000 | 100 |
| 2,000 - 2,500 | 120 |
Figure 13 shows the relationship between the number of resampling and CV. After CV decreases greatly as the number of resampling increases, the reduction rate becomes stable. A method of determining the required number of measurements using the stability of this reduction rate as a threshold is also used. Therefore, the number of resampling where the rate of decrease of CV becomes almost stable is 30. This number of resampling is considered to be the target value for the required number of measurements (method ②). This method is simpler than the method ① in which the required number of measurements is changed according to the density as mentioned above and will further shortens the time required for survey.
Figure 14 shows the relationship between the measured amount of biomass (measured diameters of all bamboos) and the estimated amount of biomass (estimated value obtained by randomly choosing the required number of measurements, estimating the amount of average biomass of single bamboo, and multiplying by the number of bamboos). The average deviation was 7.3% and 8.5% in Method ① and Method ②, respectively, and the correlation coefficient was 0.99, 0.98. However, accuracy will decrease in the method of deciding the target value shown in Method ① when there is a bias in size locally, and in Method ②, how to select 30 bamboos should be considered in actual ground-based survey. In addition, in Method ②, since only 30 bamboos per species per plot are measured, estimation accuracy is smaller to Method ①, but survey time can be saved. It is necessary to consider the optimum labor-saving survey method by measuring the time needed for measuring diameter and counting the number of bamboos and compare them and confirming the balance between the accuracy of survey and the time (cost).

Fig. 13 Relationship between sampling number and the coefficient of variation (CV) for average bamboo biomass
(One line segment is one species per plot)

Fig. 14 Relationship between measured bamboo biomass and estimated bamboo biomass for each plot (Left: Method ①, the amount of biomass estimated by the required number measurements according to density, Right: Method ②, the estimated amount of biomass obtained by measuring 30 bamboos)
Reference
Chan et al. (2016). Assessment of biomass recovery and soil carbon storage of fallow forests after swidden cultivation in the Bago Mountains, Myanmar. New Forests, 47(4), 565-585.
Chave et al. (2014). Improved allometric models to estimate the aboveground biomass of tropical trees. Global Change Biology, 20(10), 3177-3190.
Kiyono et al. (2007). Predicting chronosequential changes in carbon stocks of pachymorph bamboo communities in slash-and-burn agricultural fallow, northern Lao People’s Democratic Republic. Journal of Forest Research, 12(5), 371-383.
Singh & Singh (1999). Biomass, net primary production and impact of bamboo plantation on soil redevelopment in a dry tropical region. Forest Ecology and Management, 119, 195-207.