3 Establishment of verification system for measurement results (monitoring) of practical emission reductions
(1) Introduction
The use of remote sensing for monitoring forest cover conditions and carbon stocks is encouraged to ensure transparency, comparability, consistency, completeness, and accuracy when implementing REDD+. Thus, the monitoring results by remote sensing need to be examined and evaluate their accuracy. However, observation data on the ground are insufficient in developing countries, meeting these requirements is not easy. In this sub-theme, we aim to develop a verification system for measuring practical results for REDD+ in developing countries. In 2016, we 1) improved reading cards created by 2016 and introduced drones for ground survey, 2) introduced seasonal change information to interpret the seasonal forest, to achieve this objective.
(2) Improvement of reading cards and introduction of drone to ground survey
①Additional latest Landsat image field
Until 2015, we established 3-km grids throughout Cambodia to create reading cards to interpret the condition of the land cover at about 20,000 points of the intersections using Google Earth. Comparing these interpreted results with that conducted by the ground survey until last year, misinterpretation was occurred such as; deciduous forest in interpretation was the grassland or farmland in the ground survey and the evergreen forest in interpretation was farmland in the ground survey. There was no misinterpretation between the deciduous forest and the evergreen forest. Furthermore, there was a misinterpretation of reading that it was evergreen forest in interpretation but farmland in the ground survey. No misinterpretation between the deciduous forest and the evergreen forest was found. From this fact, with the high-resolution satellite data adopted in Google Earth, almost no misreading of deciduous forest and evergreen forest was seen, but the land cover interpreted as forest was read as different land cover type. Examining these mistakes, the land cover interpreted as forest in Google Earth was converted to other land use at the time of survey. Therefore, we added the Landsat images acquired on the day close to the survey date to the field adjacent to interpreted Google Earth images.
②Addition of biomass fields
We calculated above-ground biomass for forests that carried out ground survey by 2015 and added fields to the interpretation cards.
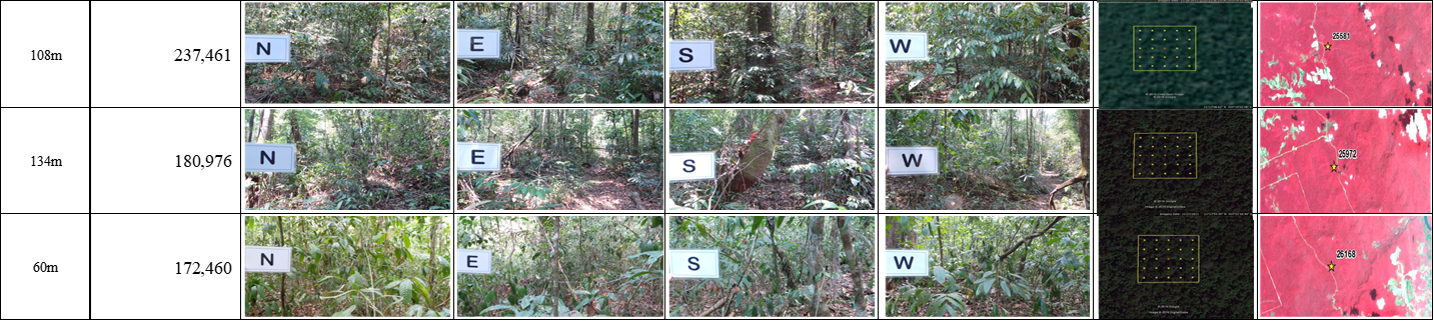
Fig. 15 Interpretation cards added biomass fields and Landsat image fields (Note: latitude and longitude are not included.)
③Creation of database to ArcGIS (Fig. 16)
We imported the database of interpretation cards into ArcGIS and improved it so that it can analyze relationship with other spatial data on GIS.
The creation of the database of interpretation cards was completed at 240 points surveyed by the Cambodian counterpart by 2015. The survey conducted in 2016 will be imported to ArcGIS as soon as the research results are completed, and the database will be created.

Fig. 16 Interpretation cards imported to ArcGIS
④Introduction of drone to confirm land cover condition
In the field survey for establishing verification system, when the survey is conducted in the forest, a complete enumeration is conducted to measure tree height and breast height diameter using sampling obtained by counting tree. On the other hand, for the land use other than forest, only the condition of the land cover is verified. In order to verify the land cover condition, take photos in four directions from the center of the survey site and record in the field note. It does not take time for the survey itself, but it takes time to reach the survey site and is hard work for researchers. Therefore, the improvement of the verification work of land cover condition will greatly affect the establishment of verification system.
In 2016, we introduced drone for the efficient verification of the land cover condition. Prior to the introduction, we invited researchers from the host country and conducted training how to fly the drone safely in the forest of the Hokkaido Research Center (Fig. 17). The purpose of introducing the drone is to verify the condition of the land cover other than forest. Since the drone is expected to be used for the forest measurement in the future, we also conducted training to create point group data, 3D model of canopy, and Digital Surface Model (DSM) from aerial photographs taken from the drone. After the workshop for introducing the drone in Cambodia (Fig. 18), we joined the field survey and explained how to shoot images from the drone in the field (Fig. 19).


Fig. 17 Training for safety flying in the Hokkaido Research Center (left) and training for aerial photo analysis (right)


Fig. 18 Workshop in the Forestry Administration, Ministry of Agriculture, Forestry and Fisheries, Cambodia


Fig. 19 Training how to fly drone (left) and aerial photographs (right)
(3) Introduction of seasonal change information to interpret seasonal forests
The land cover map created by the Cambodian government is classified by visually interpreting objects segmented using Landsat images at multiple times. Since most of the images used for visual interpretation are cloudless acquired during the dry season, it is difficult to intuitively know the seasonality of forest, which sometimes result in misinterpreting. Here, we tried to map forest seasonal change information using high-frequency observation satellite and introduced seasonal change information for interpreting the seasonal forest.
The used data are 40 scenes of NDVI 10-day of PROVA-V acquired between December 1, 2013 and January 2015. PROBA-V was launched by ESA to take over the vegetation mission of the SPOT VEGETATION. The spatial resolution is 100 m (immediately below) and 360 m (both ends of swath) in VNIR (visible light region), and 200 m (immediately below) and 600 m (both ends of the swath) in SWIR (short wavelength infrared region). NDVI 10-day is created with a spatial resolution of 333m as a product.
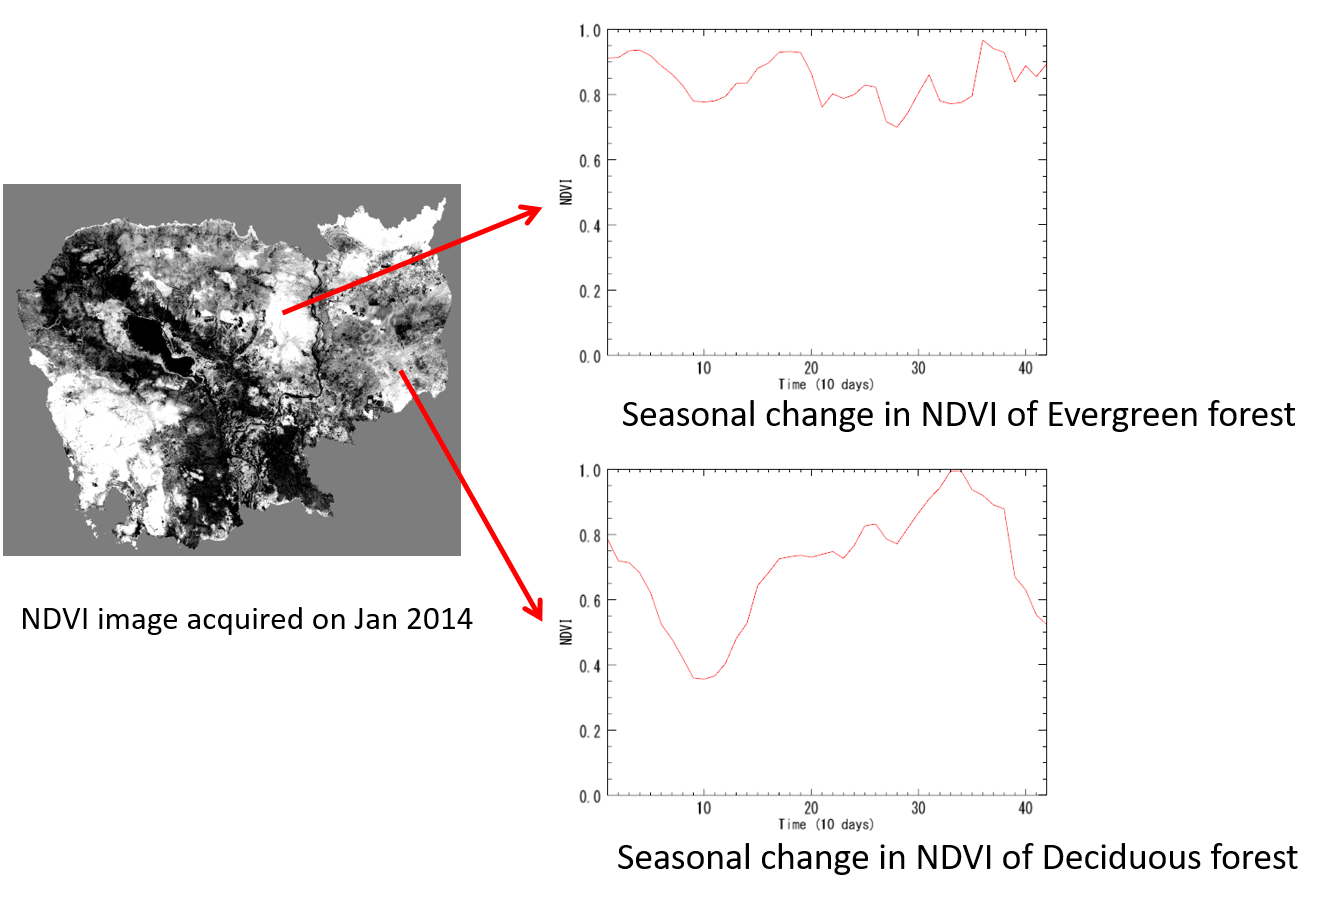
Fig. 20 Seasonal change of NDVI that reduced noise by principal component analysis
(Axis X of the graph indicates the time obtained from 40 scenes of the 10-day data.)
This spatial resolution 333 m is higher resolution than the spatial resolution of the high frequency observation satellite NDVI product that have been used to date (1 km for NOAA AVHRR, SPOT VEGETATION, 500 m for Terra/Aqua MODIS). We performed principal component analysis for 40 scenes of NDVI data in time series, and created time series NDVI data that reduced the influence of noise by performing inverse transformation using up to the third principal component (Fig. 20). From the principal component analysis image, we created color composite image (red: the second principal component, green: the first principal component, blue: the third principal component) (Fig. 21). With the principal component analysis, the first principal component is considered to show the annual average of NDVI, the second principal component show the annual change of NDVI with a cycle of half a year, and the third and subsequent principal component show shorter cycle variations than that. Therefore, in the color composite image created from the principal component image shown in Fig. 3-24, green is evergreen forest and yellow is deciduous forest. These images can be used on Collect Earth by converting to KMZ file.

Fig. 21 Color composite image created from principal component analysis image
(red: the second principal component, green: the first principal component, blue: the third principal component)
(4) Conclusion
In "the improvement of interpretation cards created by 2015", we added a field showing the above-ground biomass calculated from the complete enumeration data obtained from the ground survey and a field of the Landsat image acquired at the date and time close to the time of the ground survey, and imported them to ArcGIS to create database on GIS software. This makes it possible to associate with satellite data analysis results and to easily confirm the accuracy of the interpretation result of the satellite image for preparing the land cover map. In the ground survey, with the introduction of drone, traveling time to the study site was shortened and the time required for forest survey was increased.
In “the introduction of seasonal change information for interpreting seasonal forest”, we introduced seasonal change information useful for interpretation using NDVI data of the high-frequency observation satellite PROBA-V with a ground resolution of 333 m.
It is necessary to compile the technology developed by 2016 in a manual and propose a method that multiple readers can verify the work of satellite image and the result of that, while sharing the information.